
Founder resource
Your entire go-to-market on one page.
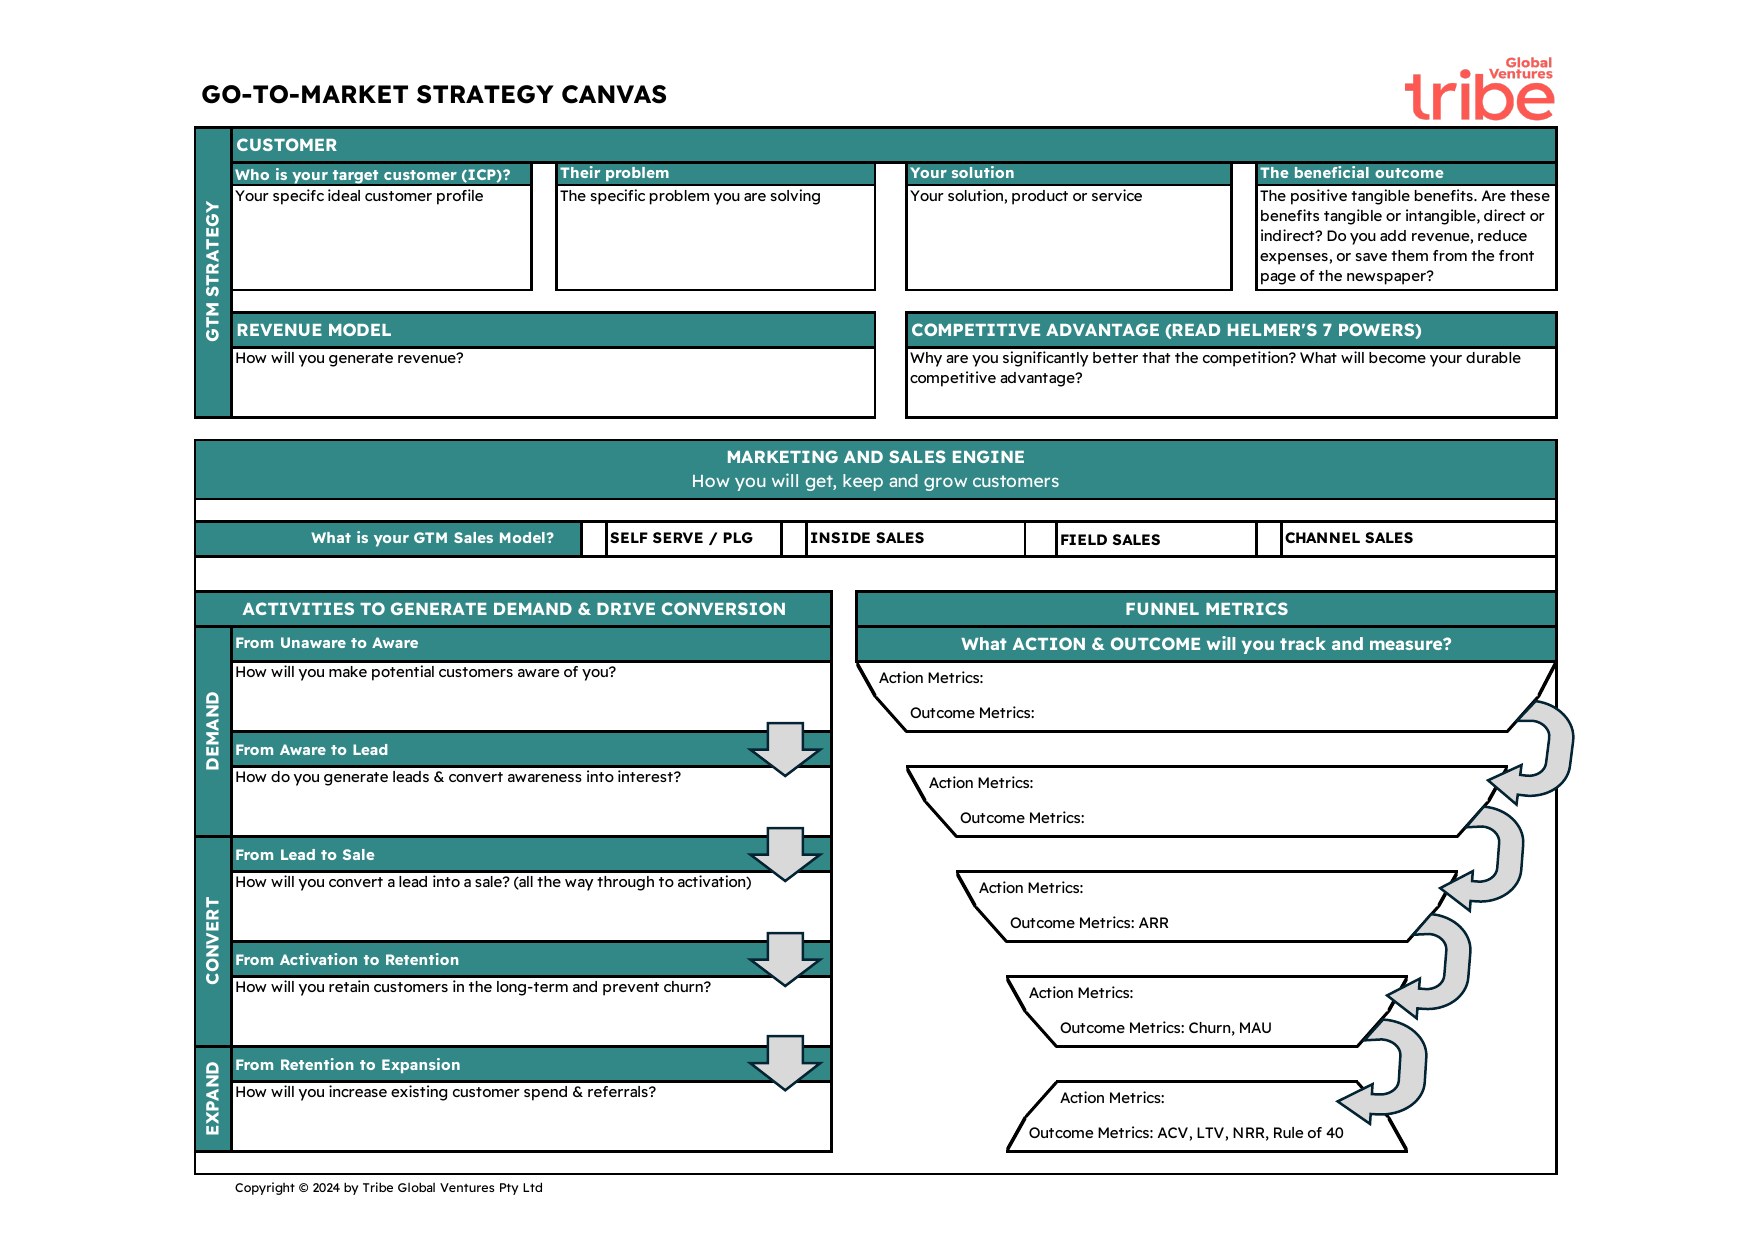
How you find, win and keep customers — with the unit economics that prove it repeats. The canvas forces all of it onto a single sheet. An investor can absorb it in ninety seconds, and the gaps in your thinking become obvious the moment you try to fill a box and can’t.
Download the canvas (Excel)PDF version
Free, no sign-up. The Excel is the one to fill in; the PDF is for printing or whiteboarding.
Watch it worked through
The GTM workshop
How to get value out of it
Do it as a team, not alone
The arguments you have while filling it in are the point.
Fill every box, or admit the gap
An empty box is a finding. If you cannot name your outcome metric for Aware → Lead, that is the thing to go fix.
Put real numbers in the funnel metrics
The canvas is only useful if the action and outcome metrics are ones you actually track. Use it to drive accountability.
Update every 3 months
And whenever you enter a new market, or learn something significant about the one you are in — those move the canvas more than the calendar does.
The five transitions
Most of the canvas is one question repeated five times, at the five points where a customer relationship can stall.
- Unaware → Aware. How will you make potential customers aware of you?
- Aware → Lead. How do you generate leads and convert awareness into interest?
- Lead → Sale. How do you convert a lead into a sale, all the way to activation?
- Activation → Retention. How do you retain customers long-term and prevent churn?
- Retention → Expansion. How do you increase existing customer spend and referrals?
Then show the detail
The canvas is the summary. Behind it, in your data room, this is what we read.
The motion
Founder-led, inside sales, channel, partner-led, product-led, or a named mix. Be honest about what is actually working versus what you hope will.
The funnel, stage by stage
Lead source → qualified → demo → proposal → closed, with conversion rates and time in stage. If you do not know these, that is the finding.
Sales cycle and ACV
Both figures, and how each has moved over the last four quarters.
Unit economics
CAC, payback period, LTV:CAC, and the assumptions inside each. Show CAC by channel, not blended — blended CAC hides the channel that is not working.
Repeatable, and not
If 70% of revenue came from the CEO's network, say so. Investors are funding the transition from founder-led to repeatable; pretending you have already made it invites a nasty diligence moment.
Channel leverage
Anything signed, and what it has actually produced.
Checklist
Before you send the data room, six things should be true.
- Primary motion named
- Funnel conversion by stage
- CAC by channel, not just blended
- Payback period in months
- Sales cycle trend over four quarters
- Honest split of founder-led vs repeatable revenue
Raising, and expanding to the UK or US?
We back B2B companies out of Australia and New Zealand and help them scale into London and San Francisco. If the canvas surfaced something you want to talk through, we read every submission.